 Appraisal · deed counts
Landowners · developers · investors
Where should we buy, hold or develop?
Compare buildings, prices and nearby constraints to find the places worth checking before you invest.
 Landometer
CityMETER
Landometer
CityMETER
Place data for real decisions
Explore examples across buildings, prices, businesses, people, access and risk, with each record’s scope and checks to make before you open a place.
Measure What Matters. Make It Actionable.
 Real CityMETER screen examples
The demo video has no sound
Start with the decision
Choose a question to see a working example and the relevant data—no dataset names to memorise.
Appraisal · deed countsLandowners · developers · investors
Compare buildings, prices and nearby constraints to find the places worth checking before you invest.
Open the real thing
Each example points out what matters and keeps the coverage and material limitation close at hand.
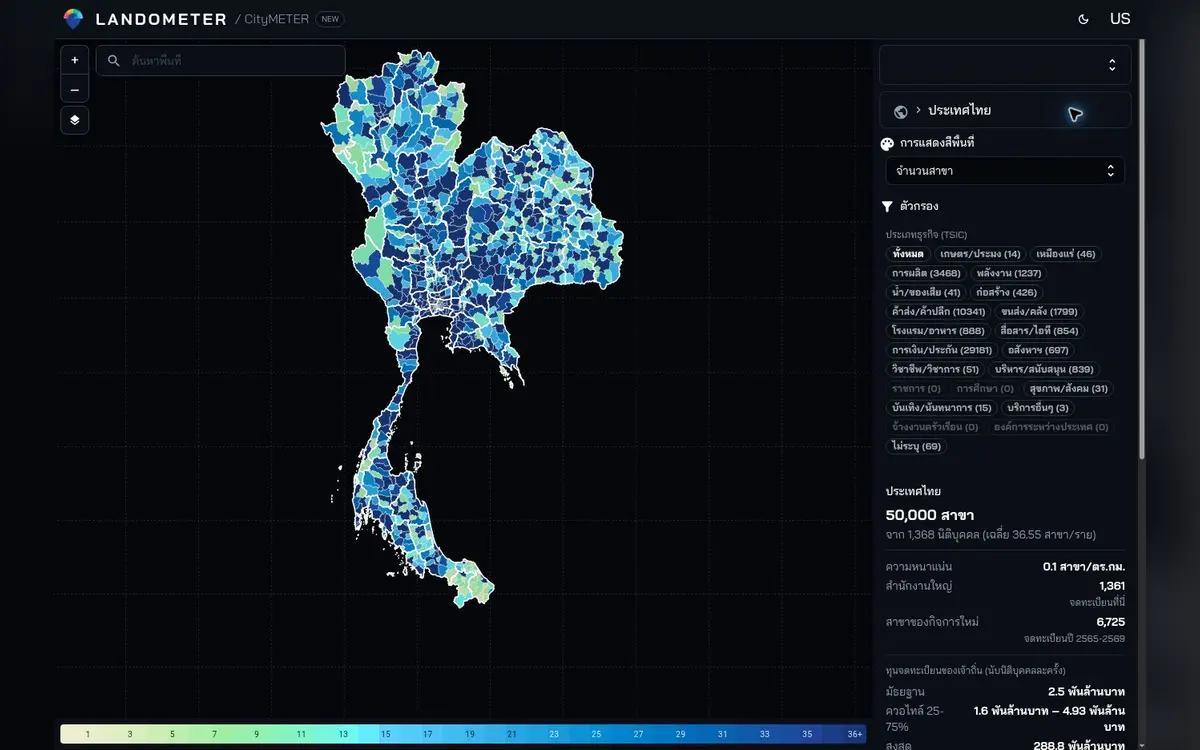 HQ · branches · new activity
Explore a sample headquarters–branch network, sectors, and newly registered branches, checking the dataset size in the details before use
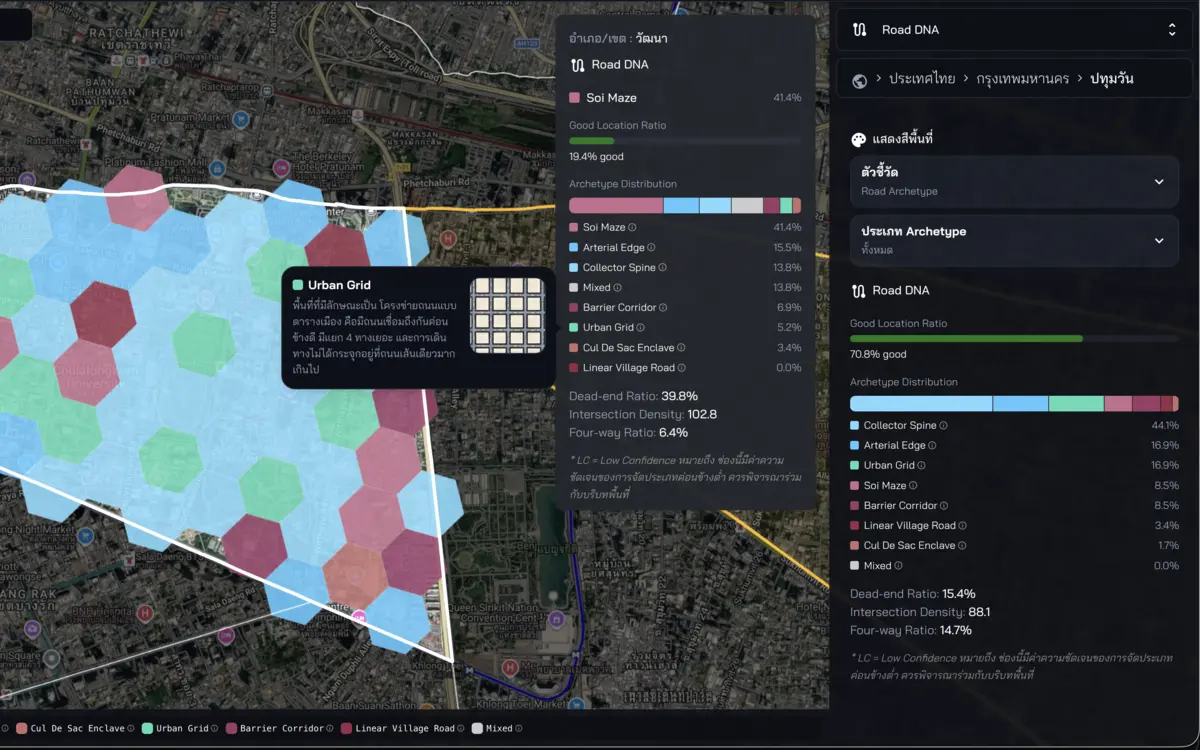 Road types · dead ends · intersections
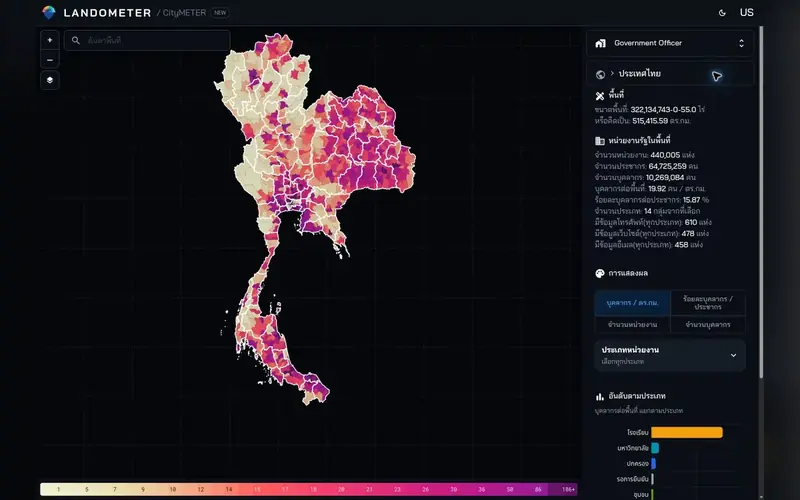
Pair coloured archetype areas on the satellite map with dead-end and intersection metrics
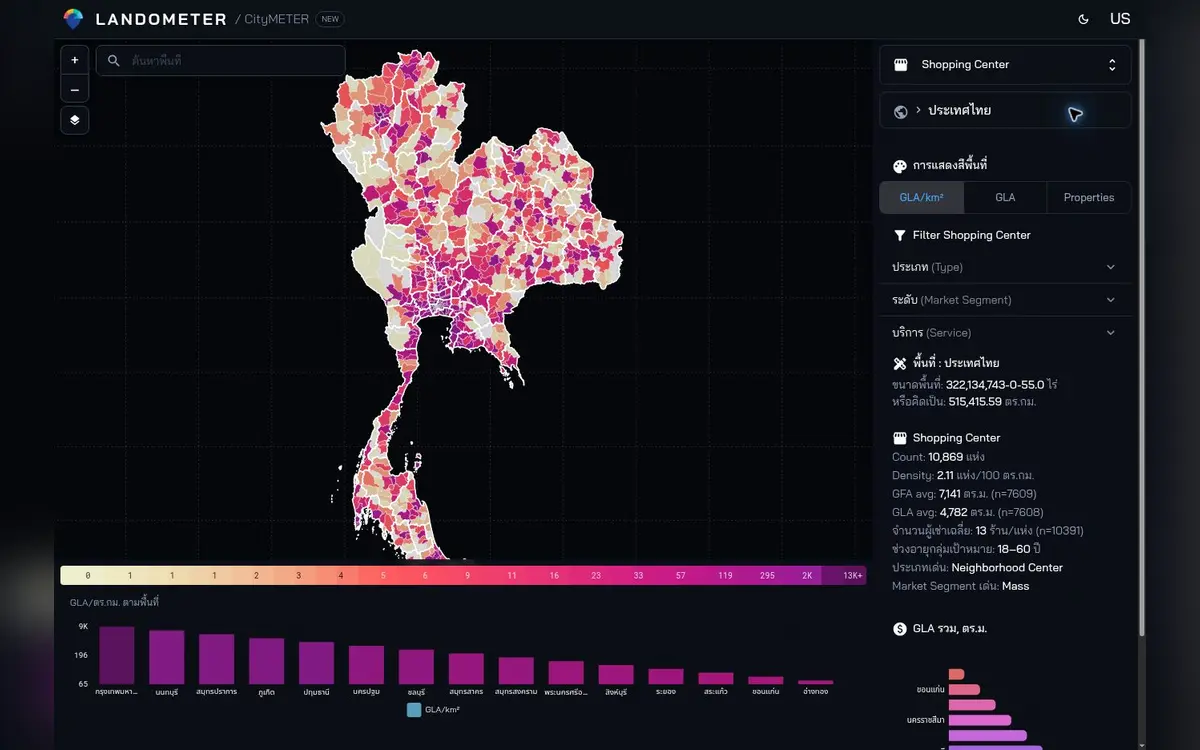 GLA · tenants · segment
Compare retail structure through supply, leasable area, tenant scale, and market segment
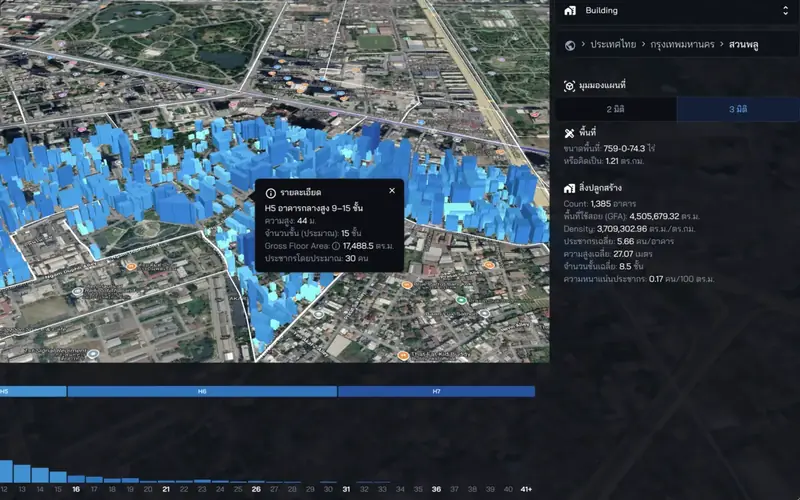
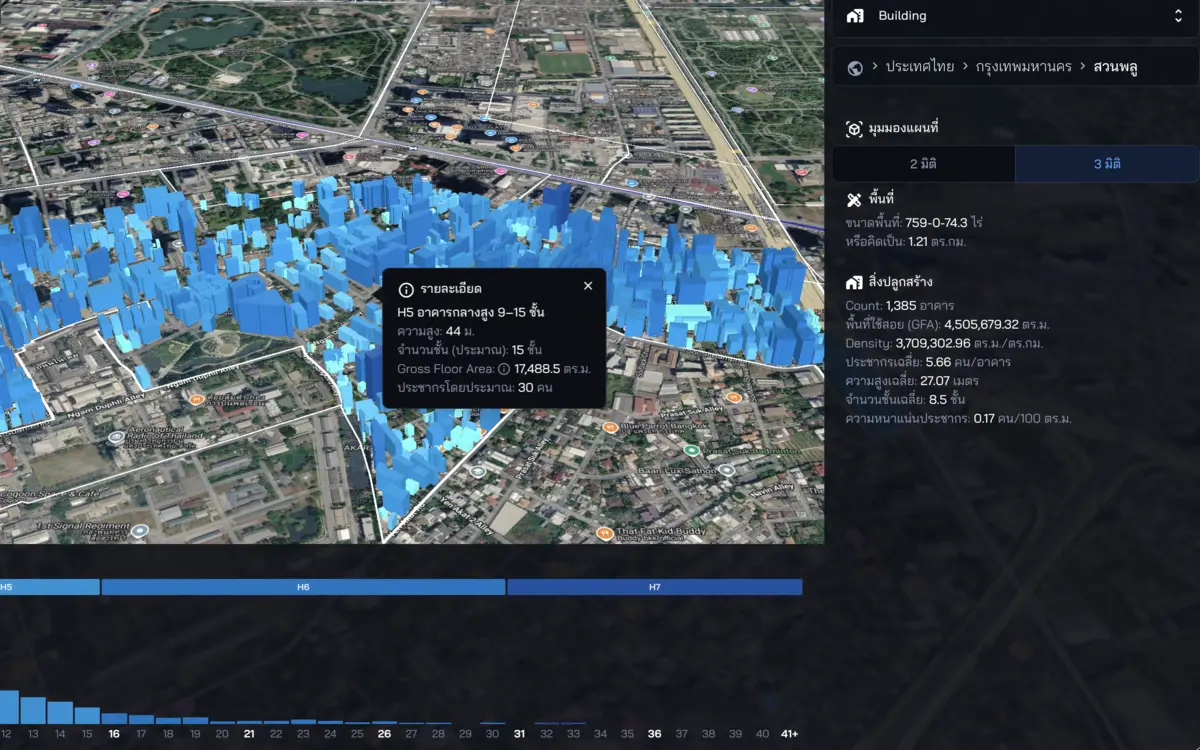 GFA · height · floors
Pair the province comparison map with GFA, height, and floor metrics to explain development intensity
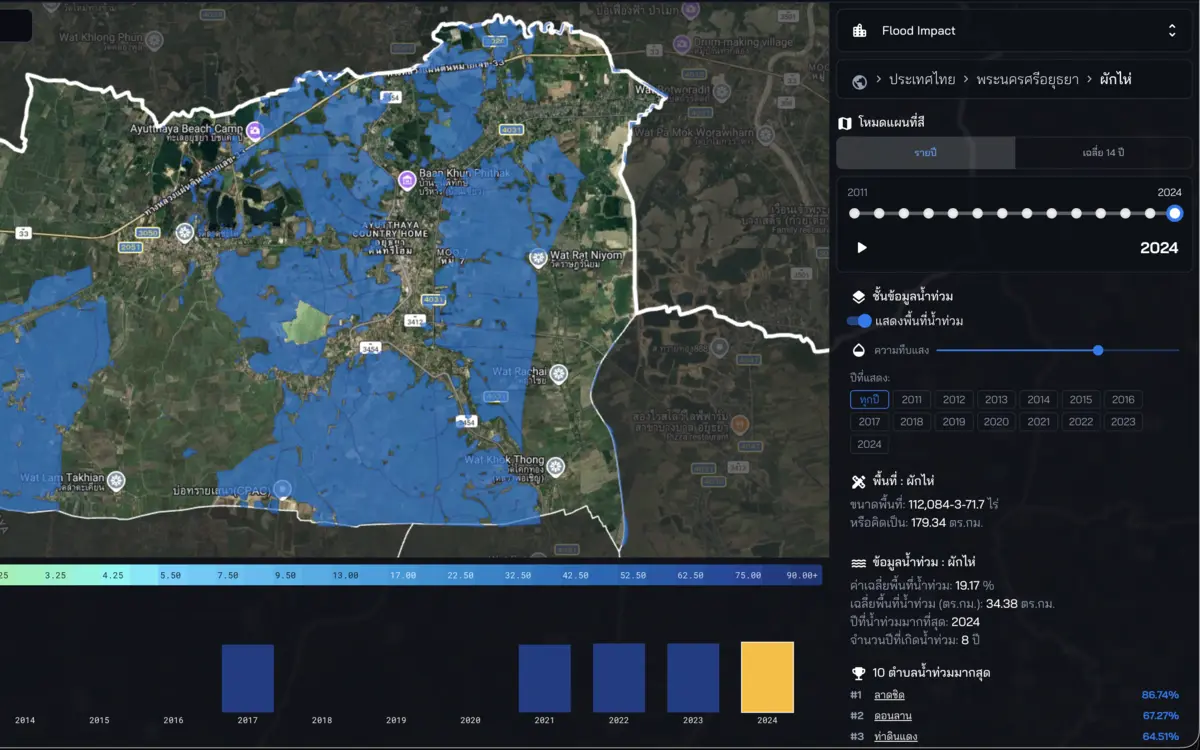 Multi-year · recurrence · worst year
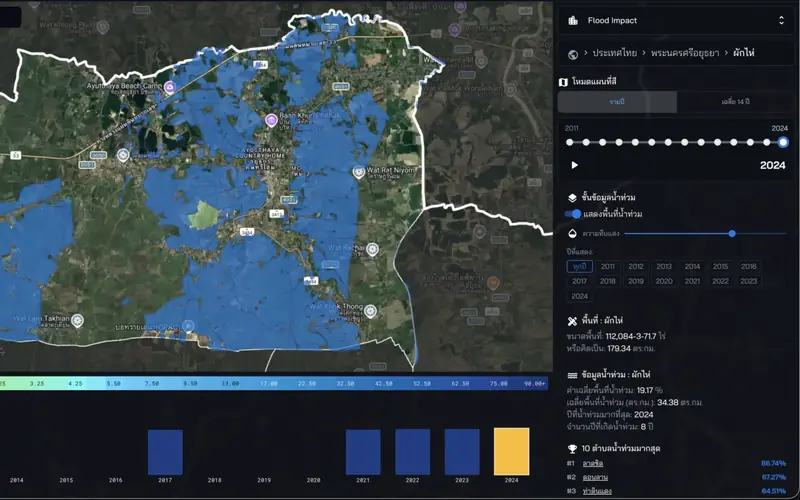
Use the multi-year timeline, recurrence count, and worst year as historical flood context, checking the source period before use
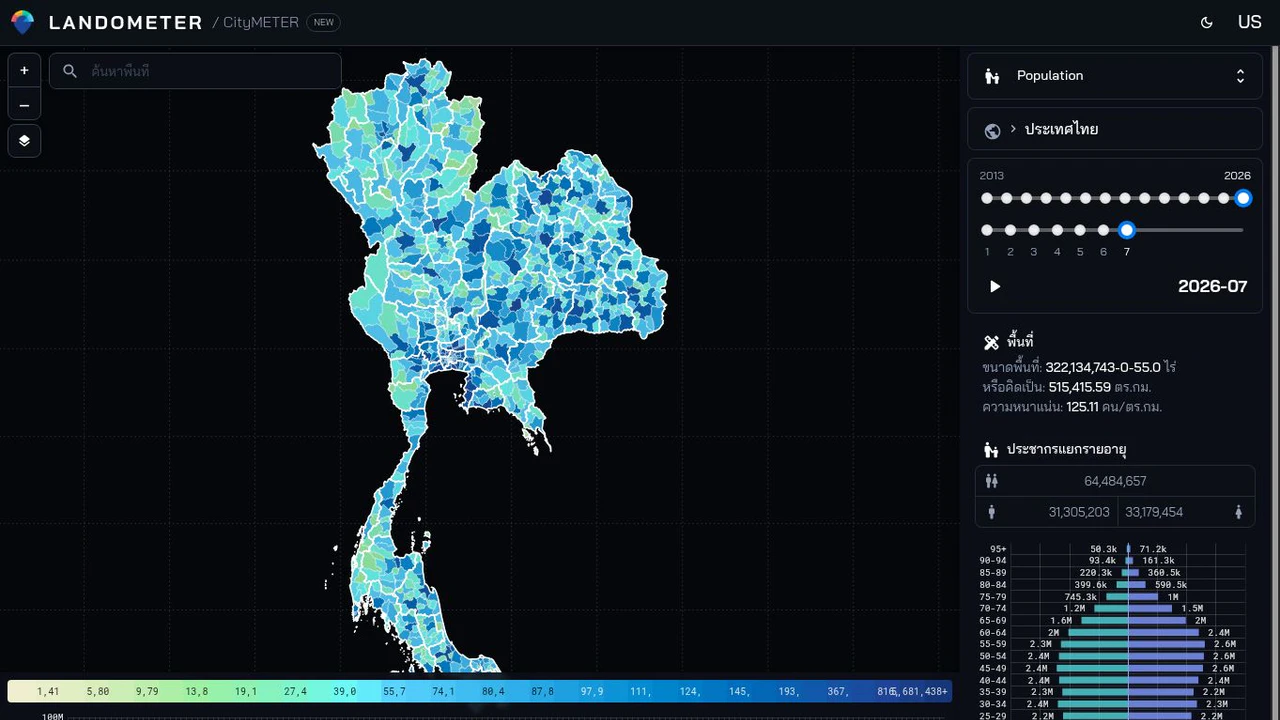
 Age · sex · density
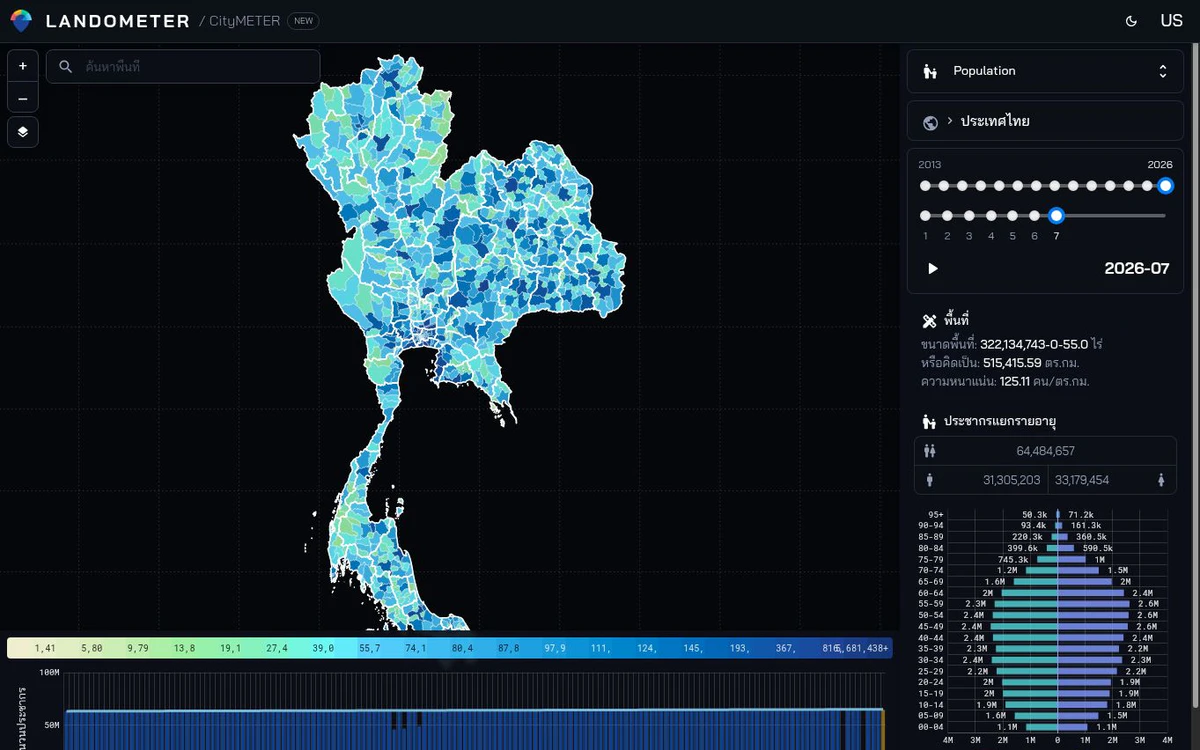
Use age-sex structure and density as baseline context for market reading and service planning
Explore the data
Search by topic or browse a group to see examples, coverage and a direct link.
38 DATA VIEWS · 3 LENSES
Land, Location and Living are peer dimensions that CityMETER connects so people can see what to check, compare and decide next in a real place.
Land · buildings · infrastructure
Business · mobility · access
People · services · everyday life
Connects 38 views so people can find, compare and see both what is known and what still needs checking.
Turns spatial context into what to check, compare and do next.
Pair the province comparison map with GFA, height, and floor metrics to explain development intensity
Do not imply that every building is covered or that individual building geometry is publicly available
Google Research — Open Buildings — CityMETER names Open Buildings directly, so this is an external source rather than GD Catalog lineage.
No verified coverage period or update cycle is recorded here yet
Use it to compare building intensity, gross floor area, height and floors at summary level—not as a building register or verified footprint for every structure.
Evidence reviewed: 14 Aug 2026
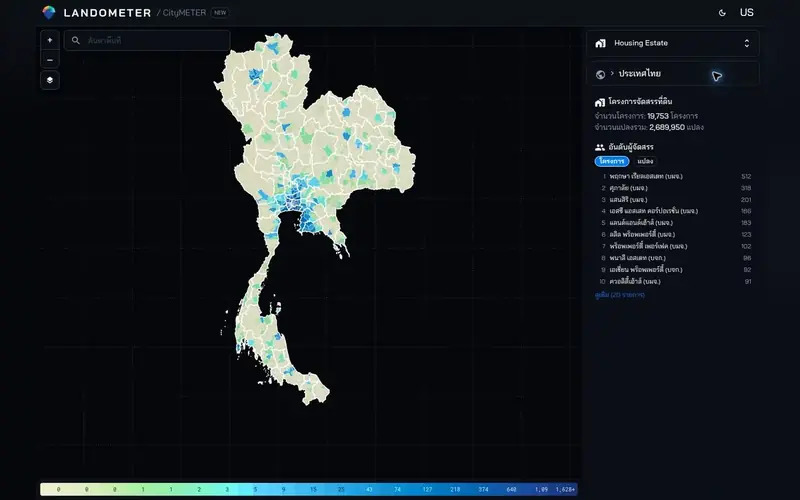
Bring project counts, plot counts, and developer ranking into one frame
This represents registered estates and should not stand in for every housing development
Department of Lands — Project, permit, developer, title-document and plot fields match the official land-allotment permit dataset.
Monthly nationwide coverage; this card uses the land-allotment part of the package.
Use it for permit history and project distribution. A permit does not prove completion, current availability or occupancy.
Evidence reviewed: 14 Aug 2026
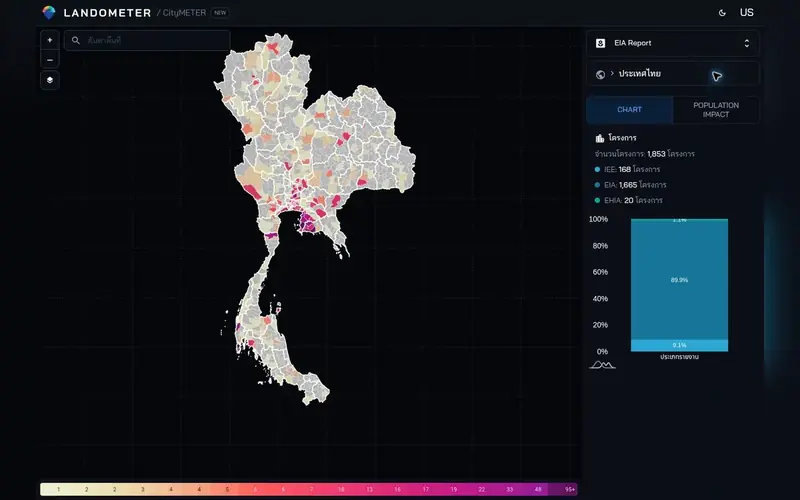
Compare IEE, EIA, and EHIA project counts alongside their location context
Use for initial context, not as a determination of development rights or approval status
ONEP — Project, owner, report type, document, approval date, category and location fields match Smart EIA.
Nationwide projects since 1992; the live API changes, so the card avoids a frozen total.
CityMETER is a curated, geocoded snapshot. Approval does not prove construction, operation or current compliance.
Evidence reviewed: 14 Aug 2026
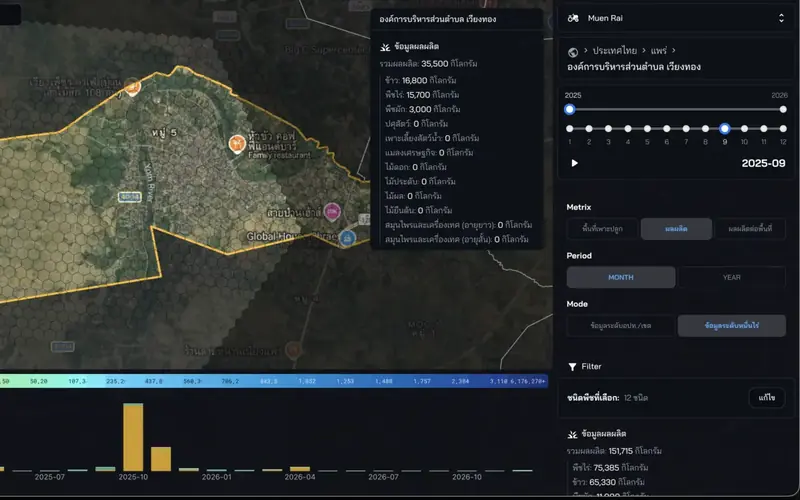
Use crop type, cultivated area, output, and period to explain agricultural land context
Confirm geographic coverage before comparing aggregate totals between places
Department of Agricultural Extension production registry family (candidate) — The field family resembles DOAE production registries, but CityMETER's 2025–2026 monthly grain and taxonomy have not been reconciled to one exact package.
No verified coverage period or update cycle is recorded here yet
Use as provisional crop-area and output context until the exact resource, taxonomy and coverage are reconciled.
Evidence reviewed: 14 Aug 2026
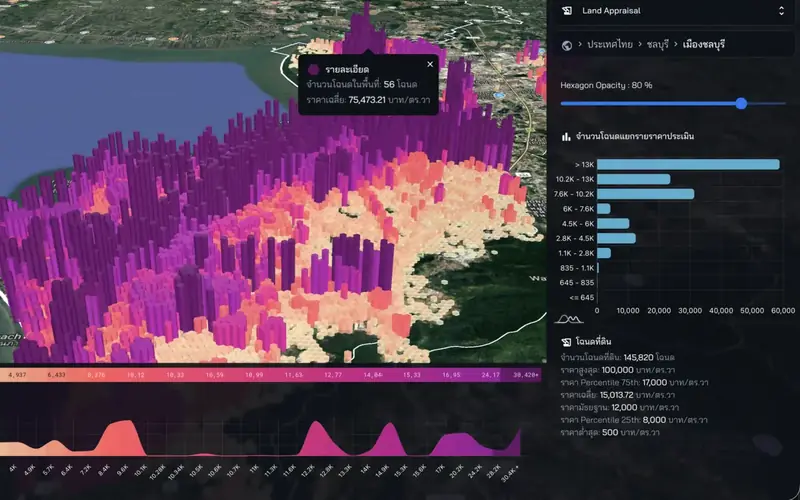
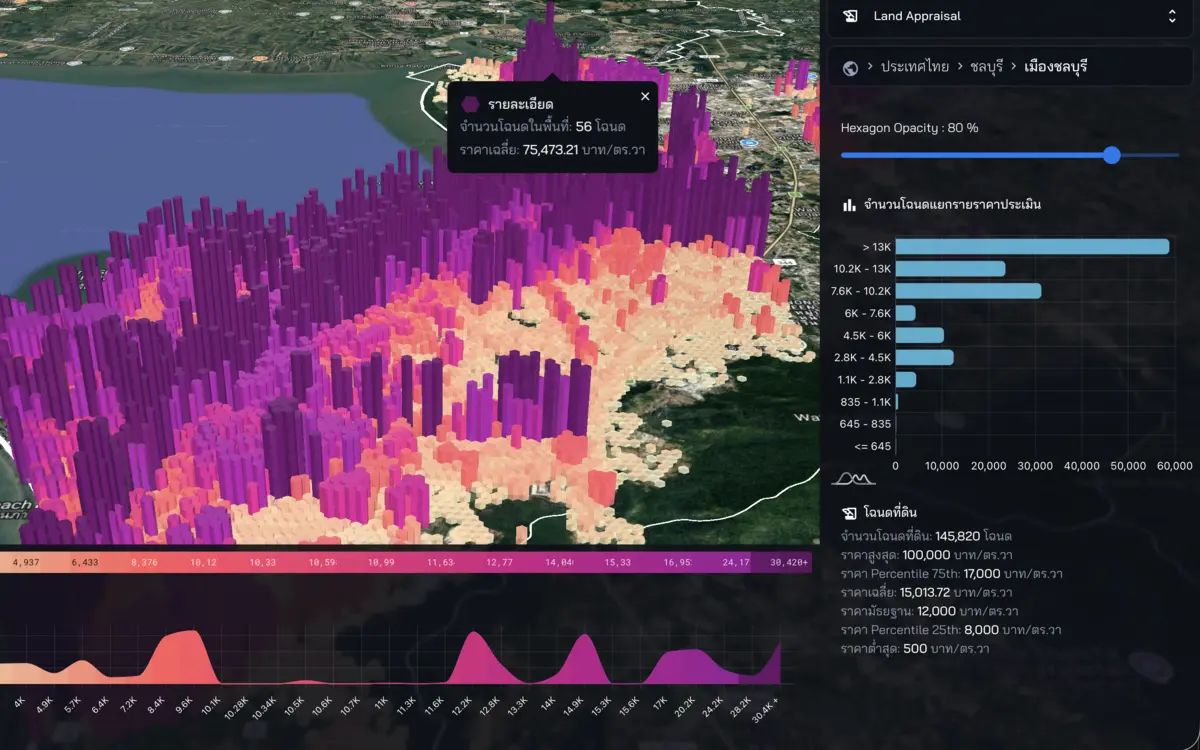
Pair the province appraisal map with title-deed counts and price distribution
Appraisal values are not transaction prices and do not replace document checks for a specific property
Department of Lands / Treasury Department — Combines parcel location and area from the Department of Lands with official Treasury appraisal values.
Versioned, transformed parcel layer; appraisal update dates vary by province.
Useful for screening and reference checks before parcel due diligence; it does not prove ownership, encumbrances or transaction price.
Evidence reviewed: 14 Aug 2026
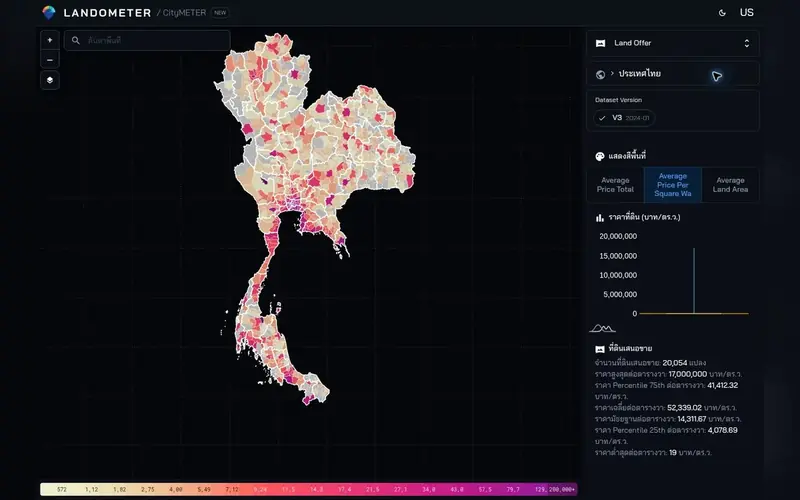
Show listing supply and price-per-square-wah distribution as an asking-market signal
Listing prices are not closing prices; duplicate and outlier handling is not yet documented
Private listing layer — public lineage not yet verified — No exact government-dataset lineage was verified for the land asking-price layer.
No verified coverage period or update cycle is recorded here yet
This is an asking-price signal, not a closing price. Verify source, collection date, duplicate handling and outlier treatment before comparison.
Evidence reviewed: 14 Aug 2026
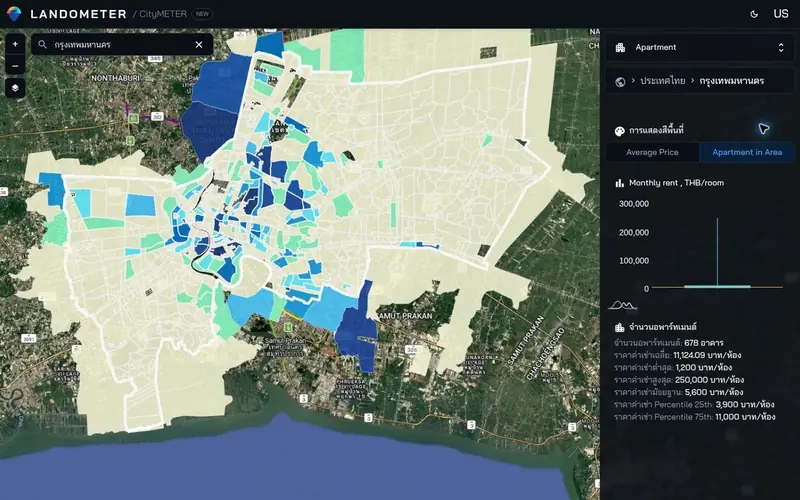
Use average rent and price ranges to compare rental-market signals between areas
Do not present this as the entire rental market or as current rent for every building
Public source lineage not yet verified — No public package or manifest currently reconciles apartment-rent records to a repeatable source.
No verified coverage period or update cycle is recorded here yet
Treat it as a sampled rent-range signal, not the whole market or current rent for every building.
Evidence reviewed: 14 Aug 2026
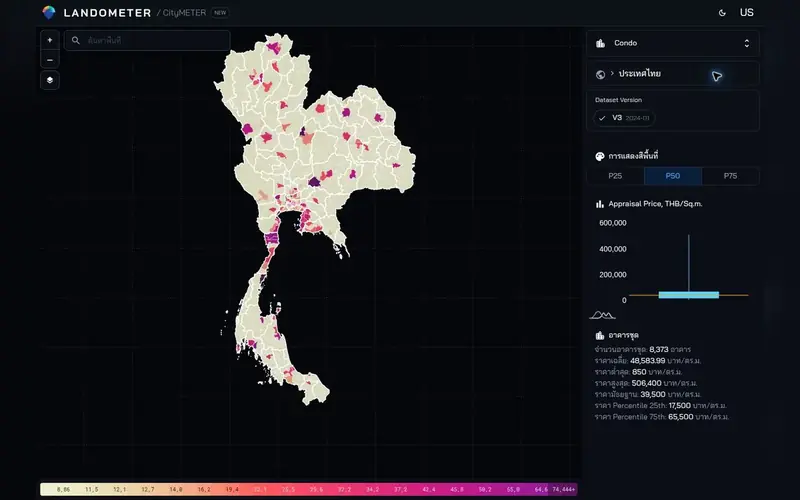
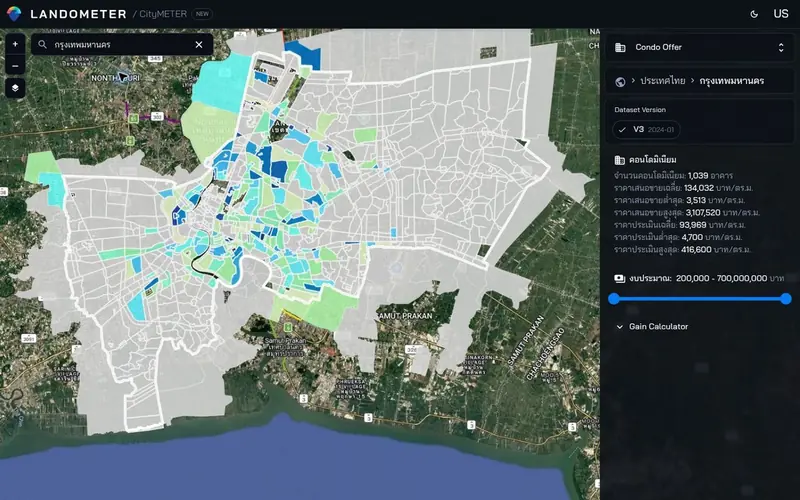
Use P25, P50, and P75 as a value baseline before comparing listing prices
Appraisal values are neither listing prices nor transaction prices
Treasury Department — Project/building schema and appraisal values align with the official condominium valuation dataset; CityMETER is a transformed snapshot.
The source states a four-year cycle; the inspected resource was updated 14 Aug 2024.
Use it as an official value baseline before market comparison; appraisal is neither listing nor latest transaction price.
Evidence reviewed: 14 Aug 2026
Pair asking prices with appraisal values to reveal the gap before project-level analysis
Asking prices are not closing prices; duplicate and outlier handling is not documented
Private asking-price layer + candidate Treasury benchmark — The appraisal benchmark is official, but condo/building IDs and the ETL join to private listings have not been fully evidenced.
No verified coverage period or update cycle is recorded here yet
Use the gap as an exploratory signal; project-level use requires duplicate, unit and join-method checks.
Evidence reviewed: 14 Aug 2026
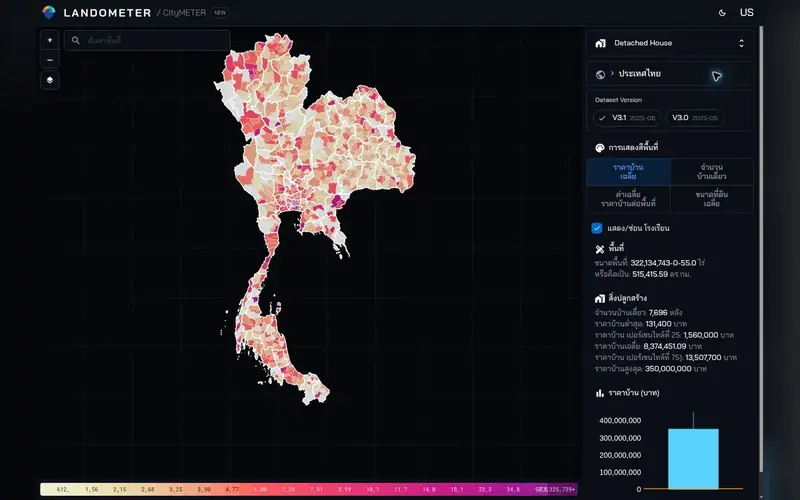
Compare price ranges with land size so the detached-house story is not reduced to one number
These are asking prices, and source coverage is not yet documented
Private listing layer — public lineage not yet verified — No public source manifest yet states coverage, vintage or deduplication rules for detached-house listings.
No verified coverage period or update cycle is recorded here yet
Price and land size help screen the market, but these are asking prices and sampling may vary by area.
Evidence reviewed: 14 Aug 2026
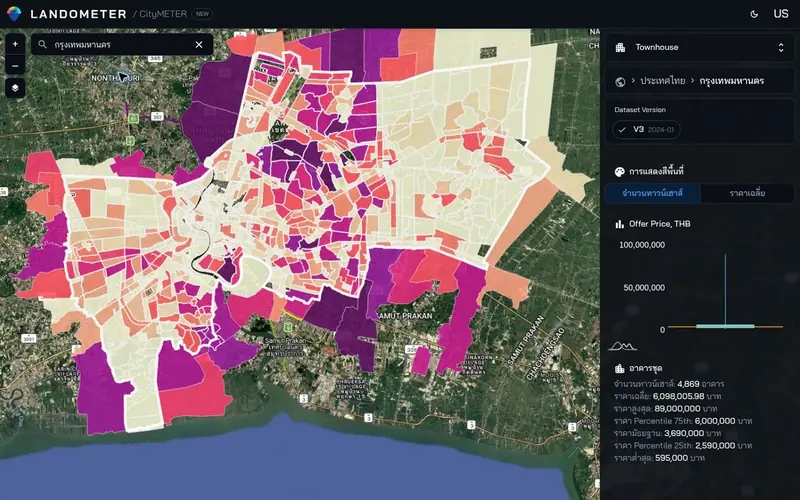
Use listing counts and percentiles to show both supply and the price range
Asking prices are not closing prices, and the current empty-state copy names the wrong property type
Private listing layer — public lineage not yet verified — No public manifest yet documents townhouse listing coverage, date, duplicates or outlier treatment.
No verified coverage period or update cycle is recorded here yet
Listing counts and percentiles show supply and asking ranges, not sales volume or closing prices.
Evidence reviewed: 14 Aug 2026
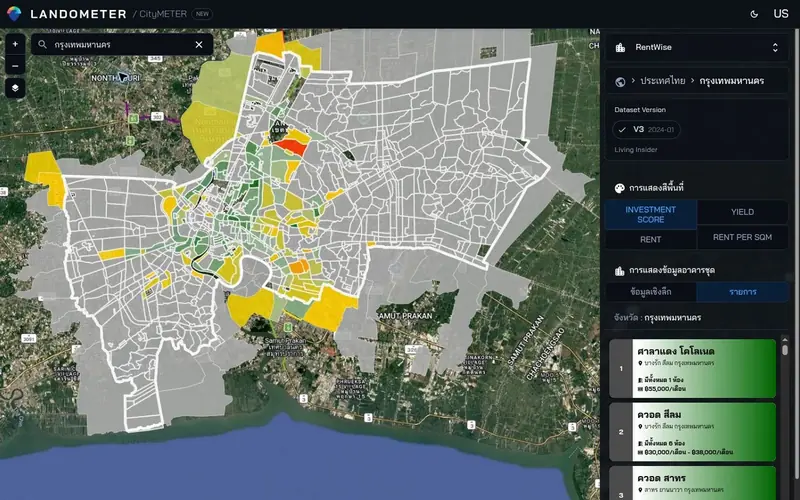
Lead with rent, estimated yield, and investment-score cards rather than a wall of listings
Yield is estimated from listings and is not a guaranteed return
LivingInsider / private listings — CityMETER names LivingInsider directly, so this is not GD Catalog lineage.
No verified coverage period or update cycle is recorded here yet
Rent, yield and investment scores are listing-derived; verify assumptions, costs, vacancy and duplicates before decisions.
Evidence reviewed: 14 Aug 2026
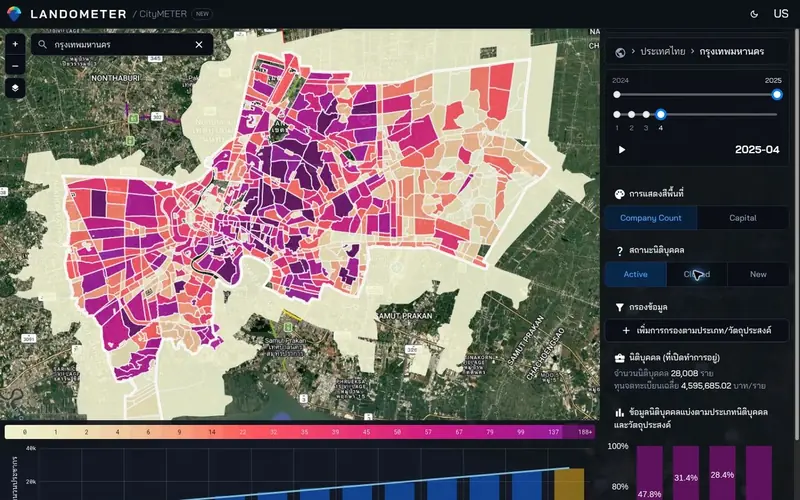
Use company status and capital distribution to explain the business base for the stated period
This is separate from Business Dynamics and should not be presented as every legal entity in Thailand
Department of Business Development — Uses the legal-entity register and new/dissolution events; CityMETER is a curated, geocoded subset.
CityMETER snapshot: Apr 2024–Apr 2025; verify each resource title rather than inferring event type from package ID alone.
Legal registration status is not actual opening or closure, and registered capital is not investment, revenue or employment.
Evidence reviewed: 14 Aug 2026
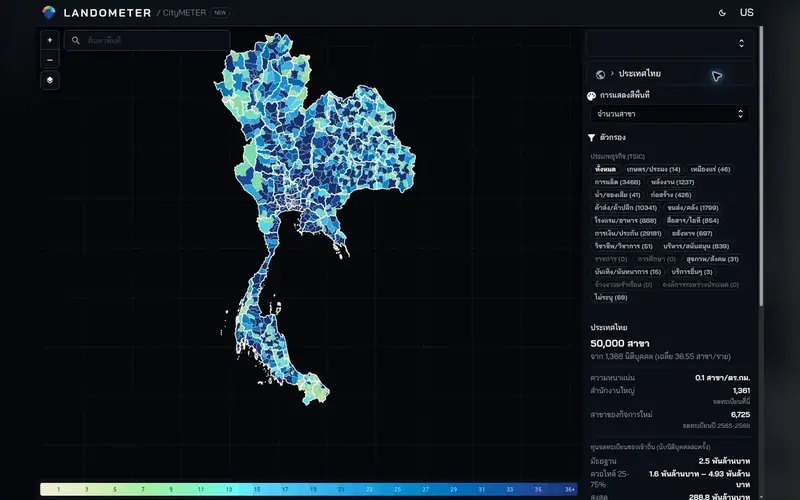
Explore a sample headquarters–branch network, sectors, and newly registered branches, checking the dataset size in the details before use
This is not a count of every business or actual openings and closures; branch definitions, sampling, and linkage still need documentation
Revenue Department — Records were reconciled by legal-entity number, branch code, name and address against the VAT operator register.
Monthly source; CityMETER is a transformed snapshot.
CityMETER uses a geocoded subset of the branch register, but this page does not yet expose a public transformation snapshot that proves its size. A registered address is not proof of operation at that point and does not cover every business.
Evidence reviewed: 14 Aug 2026
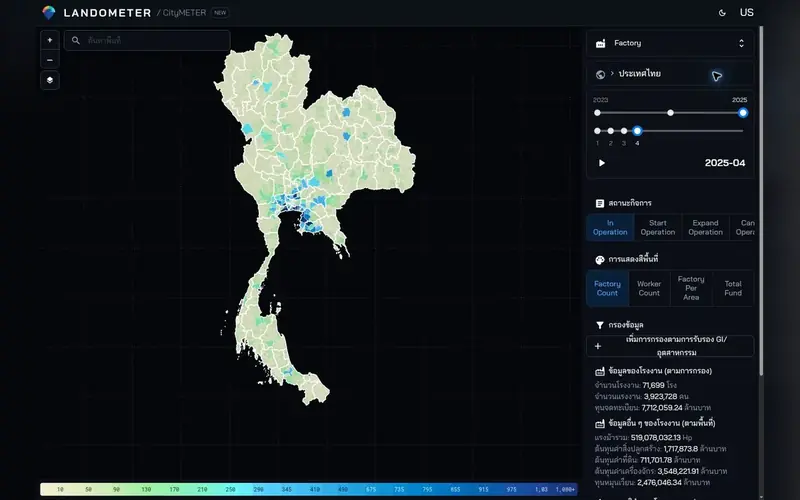
Combine factory, worker, capital, and machinery metrics into one industrial-base story
Definitions, source, and registry coverage are not yet documented on the public page
Industrial factory register (high-confidence candidate) — The field fingerprint matches the factory register, but factory-ID reconciliation or an ETL source manifest is still missing.
No verified coverage period or update cycle is recorded here yet
Use the factory, worker, capital and machinery measures exploratorily until definitions, units and registry coverage are confirmed.
Evidence reviewed: 14 Aug 2026
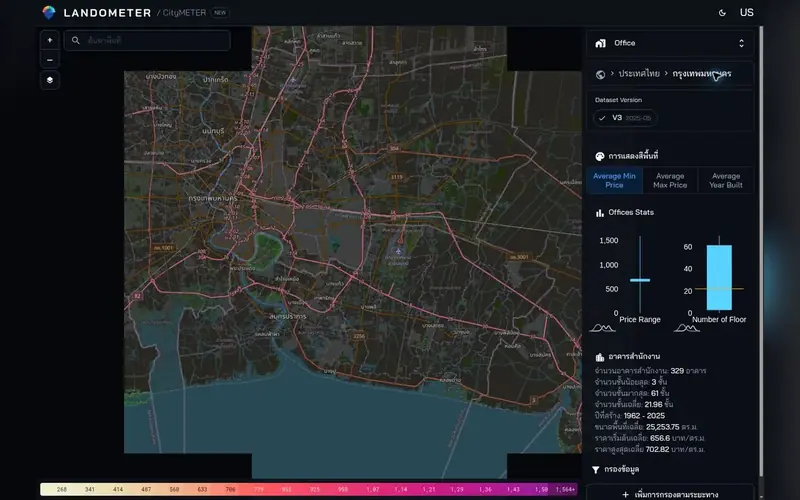
Use building supply, area, age, floors, and asking rent to frame Bangkok's office market
The evidenced scope is Bangkok, and asking rent is not contracted rent
Commercial inventory — public lineage not yet verified — The office-building and asking-rent inventory did not match the official building packages reviewed.
No verified coverage period or update cycle is recorded here yet
The evidenced scope is Bangkok. Prices are asking rents, not contracted rent or occupancy.
Evidence reviewed: 14 Aug 2026
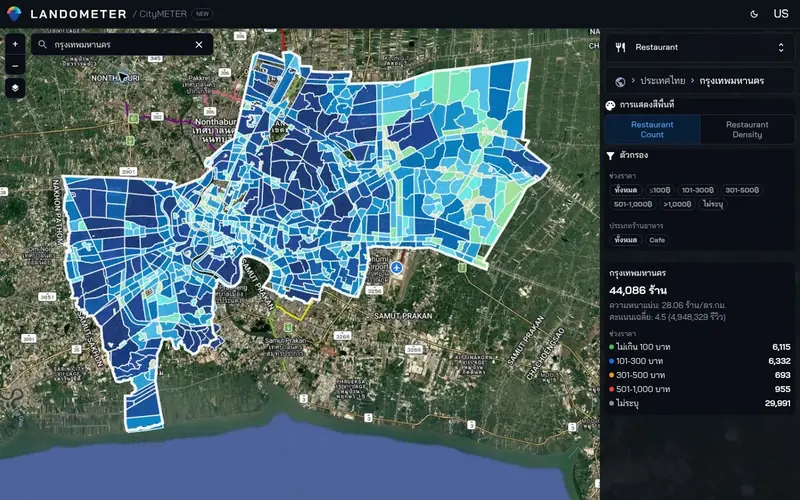
Use density, reviews, and price bands to explain the local food-competition context
Restaurant and review counts are not demand or customer counts; source and collection date are not documented
Private place/review source — public lineage not yet verified — Ratings, price bands and density did not align with the government restaurant registers reviewed.
No verified coverage period or update cycle is recorded here yet
Use as competitive context, not demand, customer count or independently verified quality; collection date and coverage are required for comparison.
Evidence reviewed: 14 Aug 2026
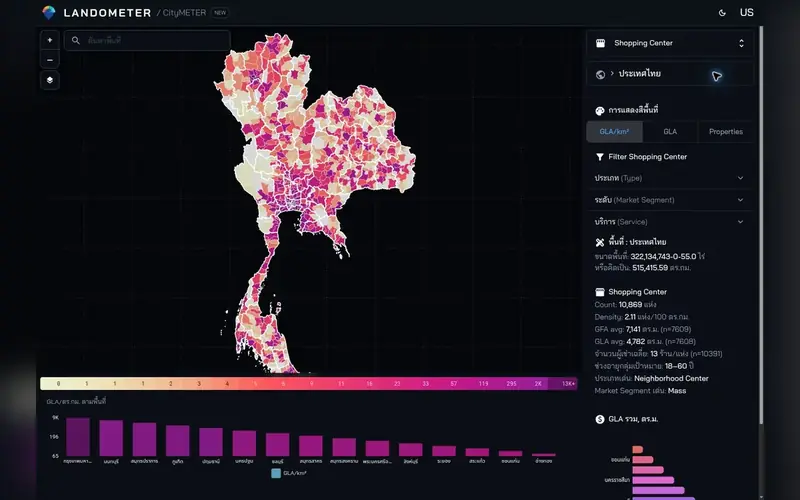
Compare retail structure through supply, leasable area, tenant scale, and market segment
Coverage differs across GFA, GLA and tenant fields; check record completeness before comparison
Commercial inventory — no matching government package verified — GLA, GFA, tenant count and market segment did not match the government datasets reviewed.
No verified coverage period or update cycle is recorded here yet
Use to compare retail structure in the sample; unequal field coverage means it should not be presented as market totals.
Evidence reviewed: 14 Aug 2026
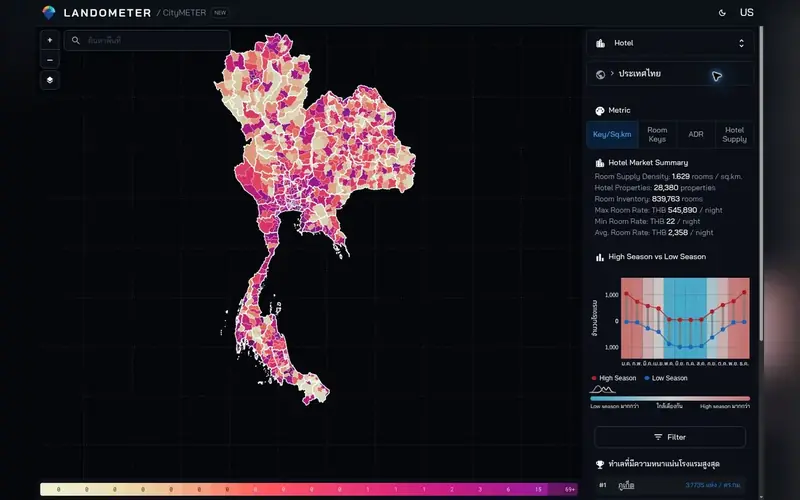
Use hotel supply, rooms, ADR, and the seasonal curve to frame the market and an initial comparison set
Source, method, and coverage are not documented, so this should not stand in for occupancy or bookings
Tourism Authority of Thailand — Accommodation (candidate) — The field signature closely resembles TAT Accommodation, but hotel and room totals have not been reconciled to the same snapshot.
No verified coverage period or update cycle is recorded here yet
Use supply, asking-rate and seasonality as an initial comparison—not as occupancy, bookings or hotel revenue.
Evidence reviewed: 14 Aug 2026
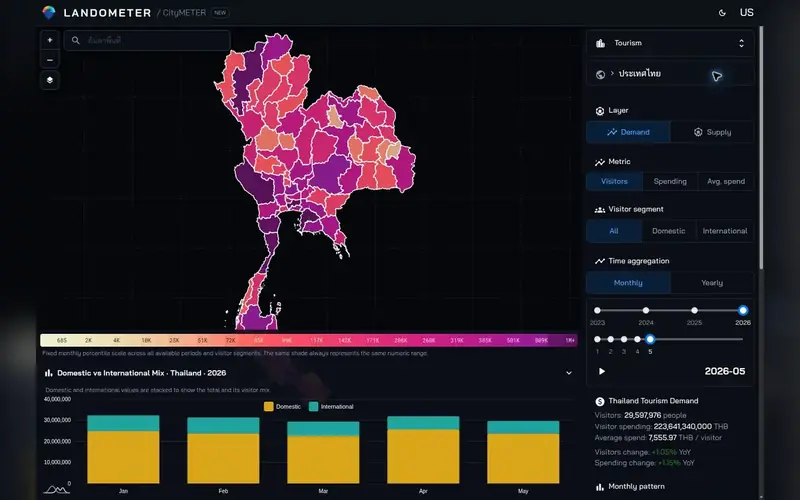
Use visitors, spending, spend per visitor, change, and province ranking to tell the demand story
Visitor and spending definitions, market split, and revision policy need confirmation before policy use
Ministry of Tourism and Sports / Tourism Authority of Thailand — Demand reconciles to the official MOTS workbook after unit conversion; activities and attractions use official TAT channels.
Year–month–province grain; exact values reconcile to the official workbook, not every byte of the frozen GD JSON.
Compare visitors, receipts, seasonality, activities and attractions. Visitor counts are not unique people and figures may be revised.
Evidence reviewed: 14 Aug 2026
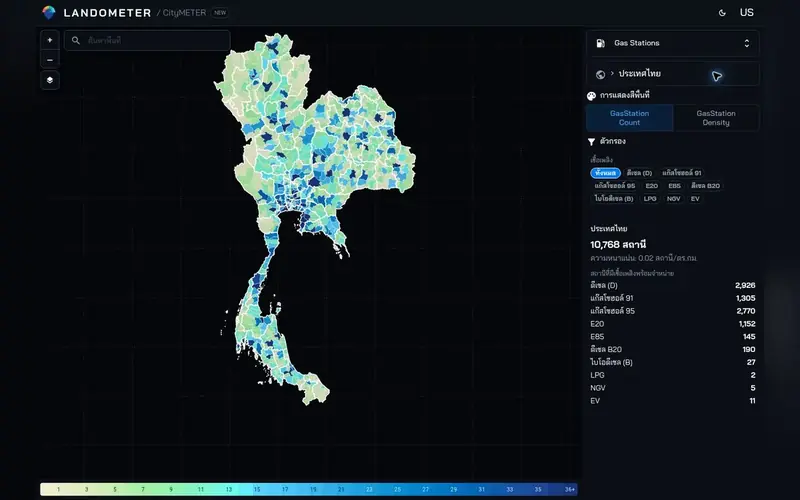
Use station counts, density, and fuel mix to explain automotive-service availability
Station definition, registry scope, effective date, and EV, LPG, and NGV counts still need confirmation
No official package yet matches the displayed fuel mix — The DOEB package reviewed did not contain the same EV, LPG, NGV and fuel-availability mix shown by CityMETER.
No verified coverage period or update cycle is recorded here yet
Use as provisional automotive-service context until station definition, effective date and multi-fuel counting are verified.
Evidence reviewed: 14 Aug 2026
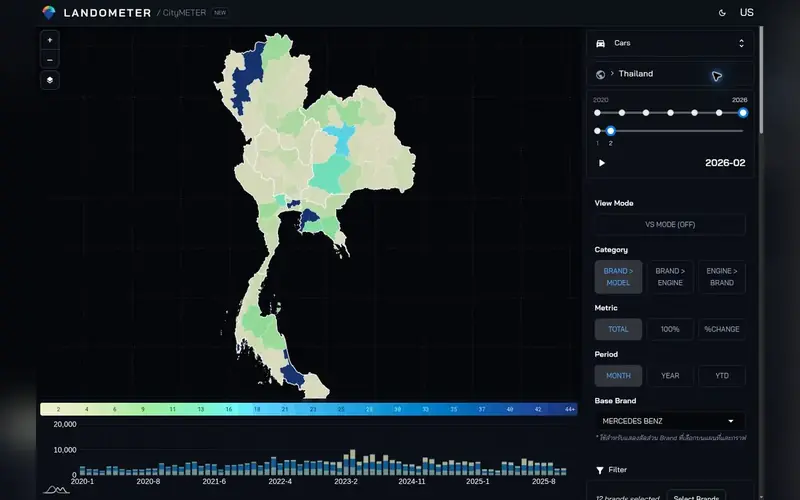
Pair the province map with brand, model, category, and period to explain the registered-vehicle base
The counted object still needs confirmation as cars or all vehicle types, and should not be read as travel behaviour
Department of Land Transport — February 2026 values were reconciled at year, month, vehicle type, make, model and count level.
Monthly national statistics; CityMETER shows Jan 2020–Feb 2026.
This is first-registration statistics, not the active fleet, travel behaviour or where vehicles operate.
Evidence reviewed: 14 Aug 2026
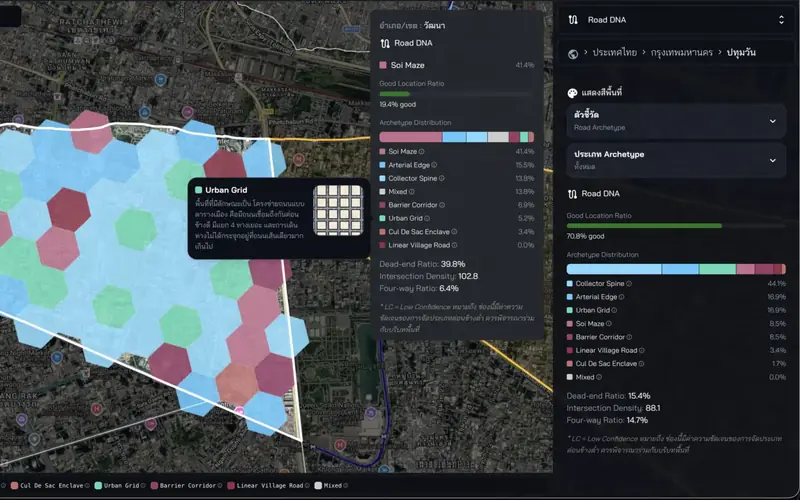
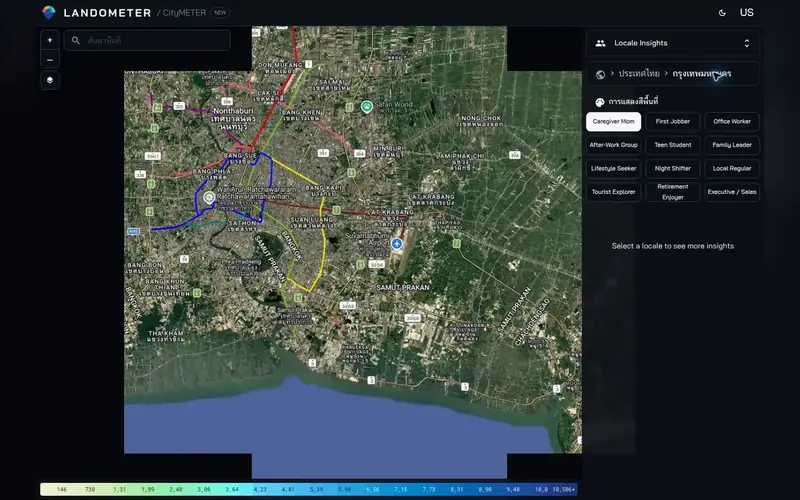
Pair coloured archetype areas on the satellite map with dead-end and intersection metrics
A network archetype is not observed traffic or an access score; show the confidence state when available
CityMETER derived model — This is a derived road-network model rather than an atomic GD Catalog dataset.
No verified coverage period or update cycle is recorded here yet
Dead-end and intersection measures are diagnostic signals—not location quality, accessibility, traffic or a good/bad verdict.
Evidence reviewed: 14 Aug 2026
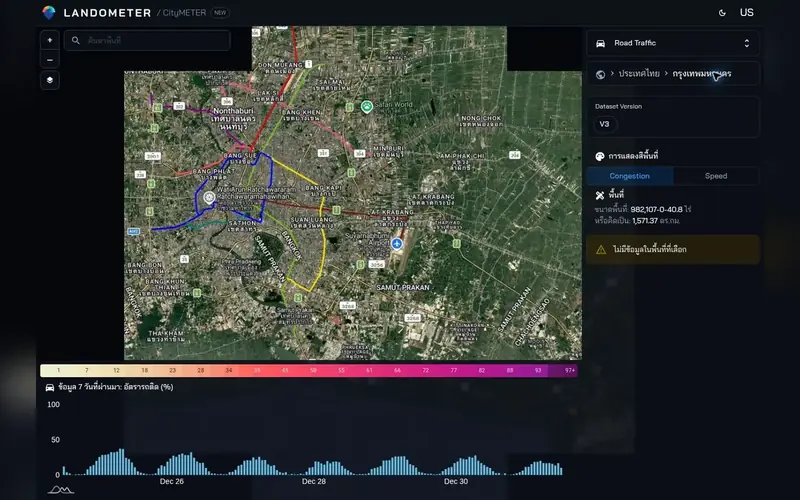
Use speed, congestion, and the seven-day trend when the feed status is available
A delayed or unavailable feed does not mean free-flow traffic, and no public update SLA is stated
Current/7-day traffic feed — public source contract not yet verified — The current and seven-day feed did not match the static OTP studies reviewed, and no public SLA was found.
No verified coverage period or update cycle is recorded here yet
Use only with timestamp and feed status visible; delayed or unavailable data does not mean free-flow traffic.
Evidence reviewed: 14 Aug 2026
Frame what should be validated in the field rather than presenting behaviour as fact
Use only for service planning, field validation, engagement, and prioritisation; aggregation requires a verified boundary crosswalk
CityMETER derived / LLM-assisted contextual layer — This is a contextual synthesis across several signals, not one exact GD Catalog dataset.
No verified coverage period or update cycle is recorded here yet
Use it to frame questions, prioritise places and plan field validation; do not treat behavioural descriptions as facts without evidence and a boundary crosswalk.
Evidence reviewed: 14 Aug 2026
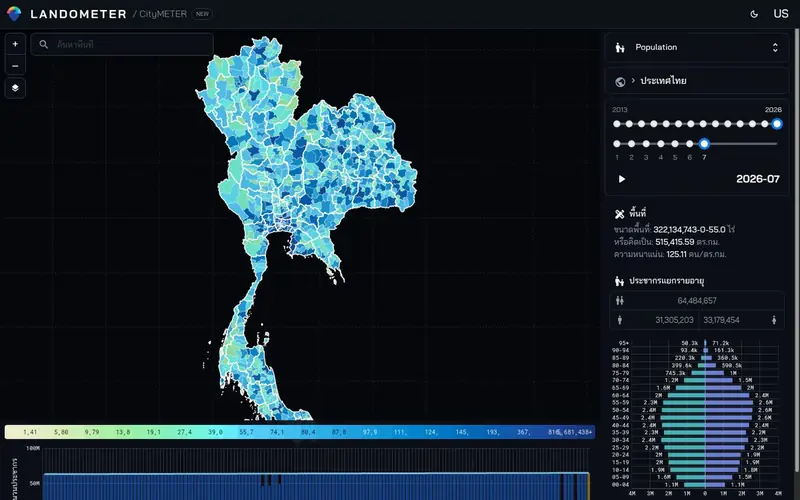
Use age-sex structure and density as baseline context for market reading and service planning
This is not daytime population, income, service eligibility, or evidence of local behaviour
Bureau of Registration Administration, Department of Provincial Administration — Monthly age, sex and area dimensions align with DOPA statistics for people listed in house registration.
The official download covers 2013–Jul 2026 and can reach village level; always show the reference month.
Use for age-structure planning, but call it registered population—not daytime, resident or live population.
Evidence reviewed: 14 Aug 2026
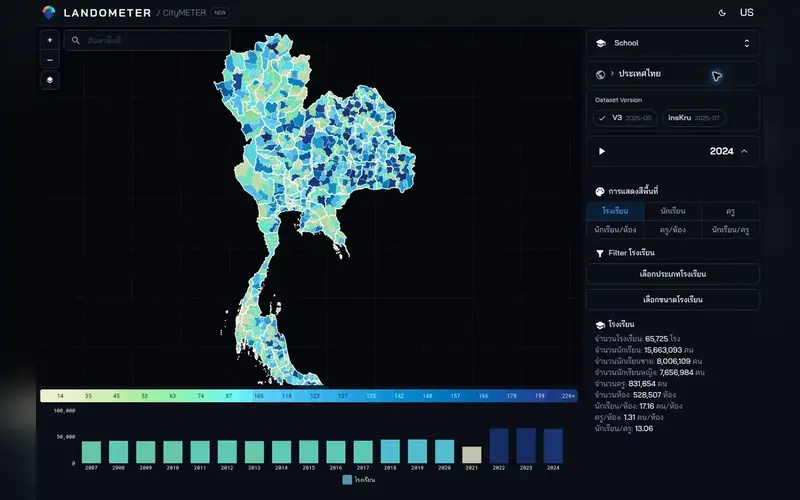
Use school, student, teacher, and ratio metrics to explain education-service context
Counts and ratios are not school quality, access, or remaining capacity
Ministry of Education (candidate) — Owner, grain and schema align with the school dataset, but school-code/name/year records have not been reconciled.
No verified coverage period or update cycle is recorded here yet
School, student, teacher and ratio measures describe service context—not quality, access or spare capacity.
Evidence reviewed: 14 Aug 2026
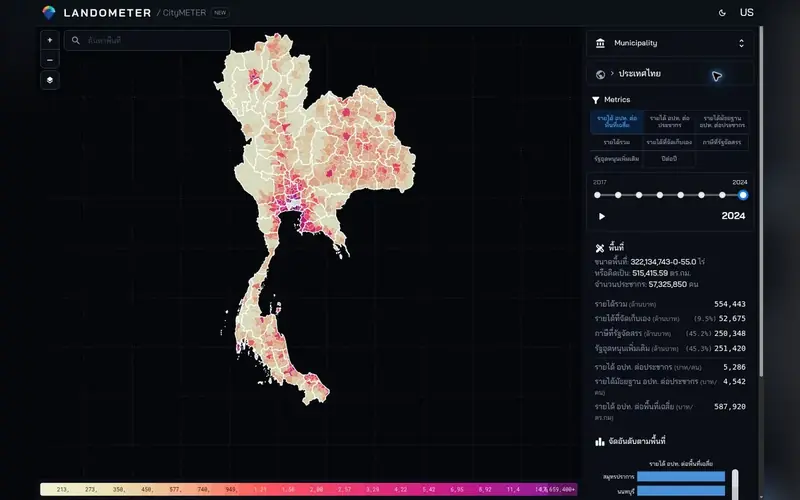
Use revenue per person, per area, and revenue mix to compare local-finance context
Revenue is not overall service quality or fiscal capacity; read it with the accounting year and denominator definitions
Department of Local Administration — The backend owner confirmed DLA localincome; fields and local-authority grain align. No exact central GD Catalog package was found.
Verified CityMETER lineage covers 2017–2024; a 2025 resource was added later to the catalogue.
Compare own-source, allocated, grant and total revenue. Per-capita/area metrics are CityMETER calculations and are not service quality.
Evidence reviewed: 14 Aug 2026
Use agency, workforce, density, and contact metrics to explain structural service context
Contact coverage is not service availability or quality, and denominator definitions still need confirmation
Composite layer — no single matching package verified — CityMETER combines agency and workforce categories, but no public manifest separates the owner and release of each component.
No verified coverage period or update cycle is recorded here yet
Counts, contacts and workforce describe service structure—not availability, quality or eligibility.
Evidence reviewed: 14 Aug 2026
Use the multi-year timeline, recurrence count, and worst year as historical flood context, checking the source period before use
Historical recurrence is neither current conditions nor a forecast and does not replace a statutory risk determination
GISTDA disaster layers (candidate) — CityMETER shows multi-year observed extents, but the located recurrence/risk package has a different period and output, so exact lineage remains unverified.
No verified coverage period or update cycle is recorded here yet
Use for recurrent history—not current conditions, a forecast or a statutory risk determination.
Evidence reviewed: 14 Aug 2026
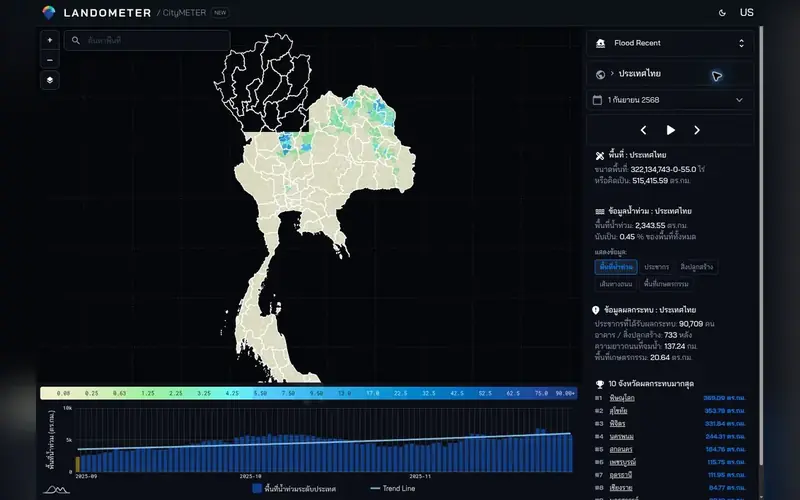
Use the extent only as a provisional snapshot after verifying its observation date at the source
This page does not yet verify the layer’s observation date or vintage; uncoloured areas are not automatically safe
GISTDA flood boundary (candidate) — Geometry may come from GISTDA, but endpoint, resource, vintage and exposure-overlay transformation remain unverified.
No verified coverage period or update cycle is recorded here yet
This page does not yet verify the layer's observation date or vintage. Uncoloured areas are not automatically safe, and a snapshot is not live conditions.
Evidence reviewed: 14 Aug 2026
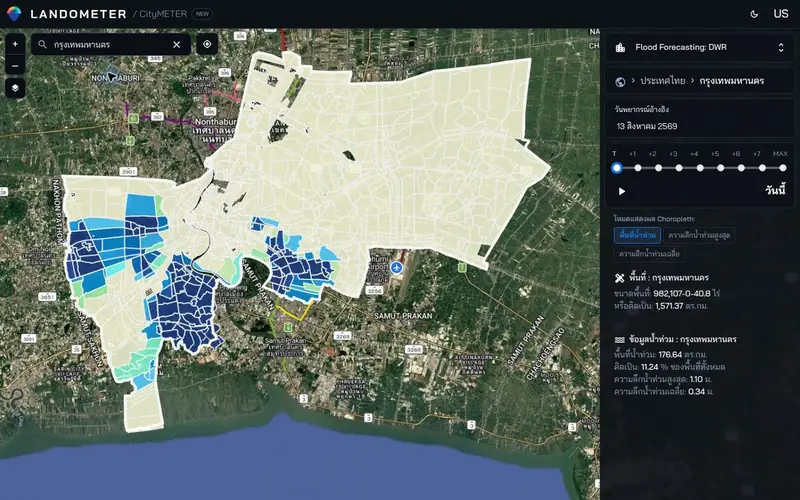
Use this record to identify the area, depth, method and run-time questions to verify before monitoring
The exact package, run time, method and model remain unverified; do not treat this as confirmation or emergency advice
Department of Water Resources forecast layer; exact public package not yet verified — Forecast runs and depth output did not match the historical-risk packages reviewed in GD Catalog.
No verified coverage period or update cycle is recorded here yet
The exact package, run time, method and model remain unverified, so this must not be treated as an observation, guarantee or emergency instruction.
Evidence reviewed: 14 Aug 2026
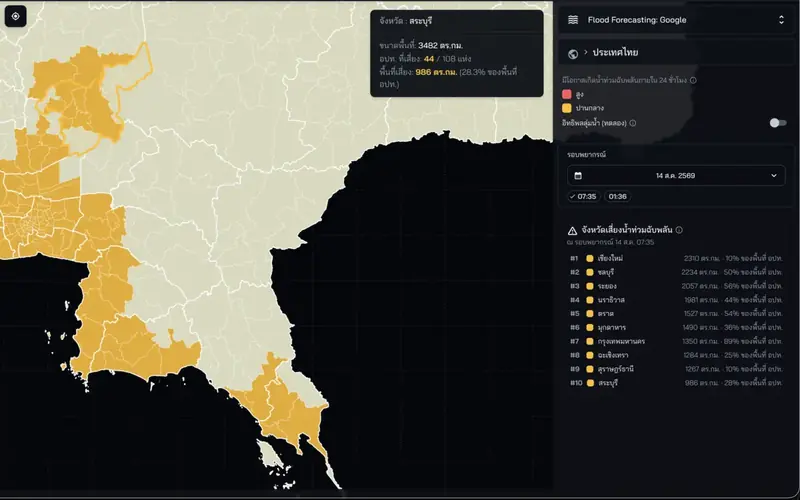
Use this record to identify the area, forecast horizon and run time to verify at the named provider source
The exact feed, forecast horizon and run time remain unverified; this is not a verified alert or travel advice
Google Flood Forecasting — CityMETER names Google as the provider, but the generic link does not prove the exact feed, model run, method or forecast horizon shown.
No verified coverage period or update cycle is recorded here yet
The exact feed, forecast horizon and run time remain unverified, so this is not confirmation of an event, an official alert or travel advice.
Evidence reviewed: 14 Aug 2026
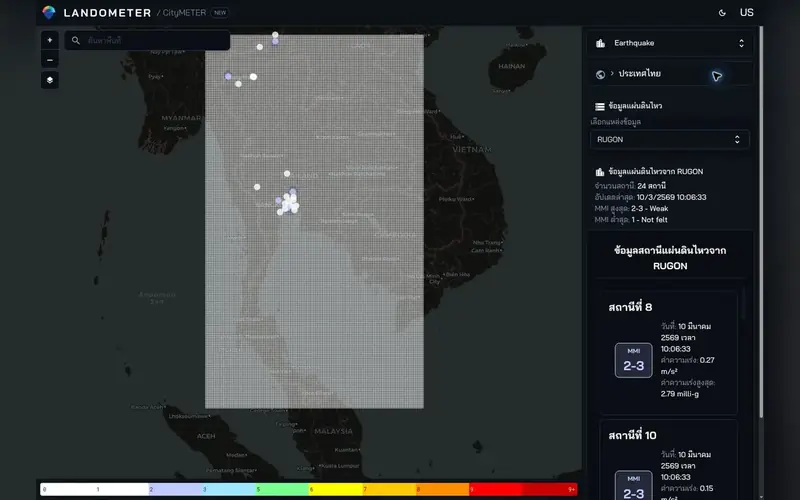
Use this record to identify the station, shaking measures and timestamp to verify at the named provider source
This page has no current freshness record; verify the station, measures and update time at the named provider source
TMD event feed with RUGON / USGS — Located GD records are station inventories or annual aggregates at a different grain from CityMETER's event/sensor view, so lineage is not counted.
No verified coverage period or update cycle is recorded here yet
This page has no current freshness record; verify station location, MMI, acceleration and update time together at the official source.
Evidence reviewed: 14 Aug 2026
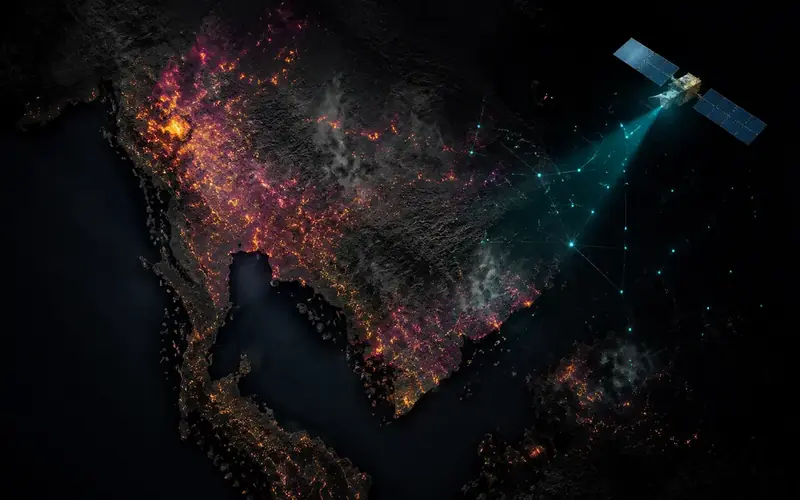
Use the time-window control as the visual and clearly mark the data object as awaiting confirmation
The data object is not yet confirmed as a hotspot, burned area, or incident, so risk conclusions are not supported
NASA VIIRS / FIRMS — The field fingerprint points to NASA VIIRS/FIRMS rather than a GD Catalog dataset.
No verified coverage period or update cycle is recorded here yet
CityMETER's unit still needs confirmation as hotspot, burned area or incident, so counts should not be turned into risk conclusions.
Evidence reviewed: 14 Aug 2026
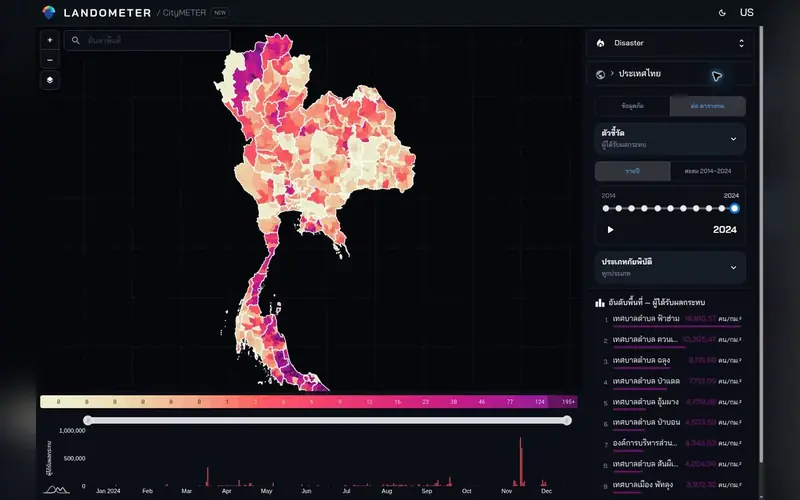
Use hazard type, year, and impacts on people, households, businesses, and assets to tell the historical story
Historical impacts are not current risk; period, source, and reporting limitations still need documentation
Department of Disaster Prevention and Mitigation — Event–area/village grain, 2014–2024 period and impact fields match the official village disaster-event statistics.
Annual CSVs for 2014–2024; latest verified data year is 2024.
Use for historical impact comparison and follow-up; one event may span several rows and the data is neither forecast nor current conditions.
Evidence reviewed: 14 Aug 2026
Pair the 24–27 November timeline with people and building context in the event area
This is a Hat Yai event archive, not a reusable flood layer or a full impact assessment
Thai PBS / ThaiHelp case reports — Core case reports come from event-reporting sources rather than a GD Catalog dataset.
No verified coverage period or update cycle is recorded here yet
Use as a 24–27 Nov 2025 event archive for sequence and context—not as a reusable flood layer or complete impact assessment.
Evidence reviewed: 14 Aug 2026
Use inspection-status charts and comments to explain post-event follow-up
This is not a sensor network, structural certification, or a current inventory of every inspected building
BMA Building Inspection Dashboard — exact record lineage not yet verified — Attribution points to the BMA dashboard, but no repeatable package or record reconciliation was found.
No verified coverage period or update cycle is recorded here yet
Use to understand post-event follow-up workflow—not as structural certification, a sensor network or a current inventory of every building.
Evidence reviewed: 14 Aug 2026
Continue on your phone
Scan to open it on your phone, save it for yourself, or share it with someone choosing a home, business location, or investment area.
Already have a place or decision in mind?
Send us the place and decision. We can point you to the relevant data and what still needs checking.